 Science
in Christian Perspective
Science
in Christian PerspectiveScience
in Christian Perspective
Letter to the Editor
On World and U.S. Population Growth:
Or Is It Growth?
J.C. Keister
Department of Physics
Covenant College
Lookout Mountain, Tennessee 37350
From: JASA 29 (September 1977): 143-144.
This communication is the outgrowth of a lecture delivered at Covenant College in the spring semester, 1975, in a course dealing with the problems of population, world starvation, ecology and energy. This lecture dealt only with world population numbers.
1. Consider a square 12 miles by 12 miles-the area of a good-sized city. The area of this square is about 3.6 billion square feet. If there was one person standing on every square foot, the entire world population would fit into this 12 x 12 mile square. Furthermore, it has been estimated that the world population is doubling at the rate of once every 30 years; 1 if such a rate were to continue, it would take over 300 years for 0.1% of the earth's surface to be occupied by standing people. These numbers are offered as "counter-rhetoric" to those who insist2 that there will not be any room on the planet in another 500 years or so.
2. There is a rightful concern about starvation, ecology, energy, etc. Unfortunately, there appears to be a tendency to lump all these problems together, and to call this lumped aggregate "the overpopulation problem." The difficulty here is that the label "overpopulation" presupposes that the answer to each of the three individual problems (starvation, ecology and energy) lies in the active control of the world population by one means or another, whereas the real answers to these problems may lie elsewhere. For example, if a man is found starving in the street, one could take him into one's home and feed him, thus solving this particular problem. However, if overpopulation is the problem, then the obvious answer is simply to pull out a gun and to eliminate the man.
3. Not all countries have an increasing population. in Ireland,, for example, the population apparently increased drastically around the early 1800's to a peak of over 8 million. Then, a potato blight struck, and about a million starved. The population continued to dwindle somewhat, even after the blight, so that the population in 1960 was about 4 million, (about half the 1835 peak). Ireland currently has one of the oldest marriage ages, one of the lowest marriage rates,- and a relatively stable population. No doubt there are other countries whose populations are quite stable.
4. There is serious question as to the accuracy of population estimates of countries such as Mainland China. "Both the Chinese admission that they have no knowledge of the previous growth rates, and the round progression from 1.9 to 2.0 to 2.1 percent per year, suggest some rather arbitrary estimates.4 Therefore, it is difficult to tell whether or not China's population is even growing, let alone how fast it is growing.
Having made the above points about the world population in general, let us consider an analysis of the U.S. population in particular (which is measured to a high degree of accuracy) and evaluate the demographers' estimates of what the population is doing as a function of time. The procedure is to fit a mathematical curve to the census date from 1790 to 1970. Short-term predictions then are made by simply extrapolating the mathematical curve. In making such an extrapolation, it is assumed that the past and the present are the keys to the future, at least on the short-term basis. Assumed also is that there will be no drastic deviation in population growth unless a catastrophic or other significant event takes place, affecting everyone.
The curves are plotted on semi-log paper to show any deviation from exponential growth. The actual data (taken from the 1974 Statistical Abstracts of the U.S.) and the mathematical fit are shown in Figure 1. The data are represented by circled dots, while the mathematical fit is represented by the solid line.
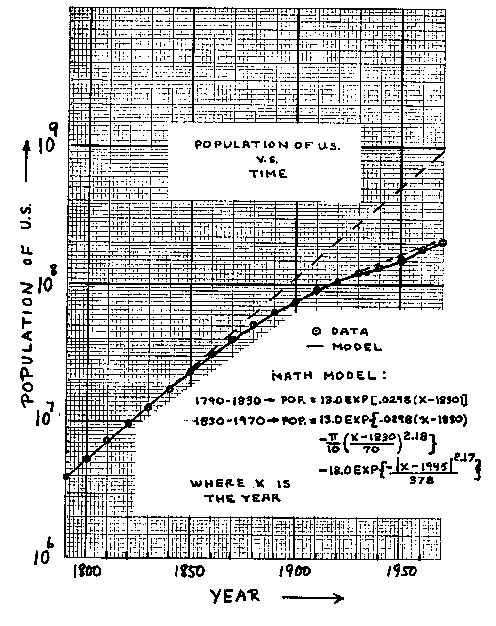
(2) The projection of the population level at 1970 (based on extrapolation of data from 1790 to 1860) is 900 million! (What would have happened had we worried about our population "explosion" back in 1850?)
(3) The U.S. population started to deviate smoothly from exponential behavior at about 1860, without any government edicts controlling the population.
(4) Note the smoothness of the curve, even through depressions
and wars.
(5) The net population effect of the 1930 depression and the
post World War 11 boom was to affect a cancellation and to
put the population trend back to where it was in the 1920's
as shown by the curved dotted line in Figure 1.
How about predictions of things to come? Demographers have calculated what are called A, B, C, D, E, F, and X curves, based on fertility rates (assumed in all cases to reach a constant level), and a constant rate of immigration. The A curve has the highest fertility rate, and the F curve has the lowest rate. Reference 5 (a 1971 pamphlet) pointed out that in 1971, curve A had been dropped and curve E had been added. Then, in the 1974 Statistical Abstracts,6 curve B was dropped and curves F & X were added. Curve C assumes a leveling off birth rate of 2.8 children/woman; D has a final rate of 2.5, E is 2.1 (so-called replacement rate) and F is 1.8 (below replacement rate). Curve X has a birth rate of 2.1 with no immigration, while curves C-F assume an immigration rate of 400,000 per year. The projections for curves C-F and X for 1972 are quite good, but by 1975 the C and D projections start to show considerable deviation from the actual data, while curves E, F and X, together with the mathematical fit of Figure 1, seem to predict the 1975 population the best. 14
Why can't demographers come up with a good model? Why must they keep adding and dropping curves? The primary reason (as they themselves have stated) is that they are trying to second-guess the birth rate of people free to make their own decisions about their families, a Congress and an Executive branch capable of regulating immigration, and a Supreme Court capable of legalizing abortion. Let us consider each of these three aspects separately.
The demographers in each of their separate graphs are assuming a leveling-out process for the birth rate. Does past history justify this assumption? The rate dropped drastically in the 1930's, rose by almost a factor of 2 from 1935 to 1960, and then fell again by close to a factor of 2 from 1960 to 1970.8 Therefore, assuming constant (or nearly constant) fertility rates over decades is a very risky business, based on past history.
How about the second assumption - constant immigration? A drastic plunge in immigration rate from close to I million/year in 1900-1910 to less than 0.1 million/year in 1931-1940 has occurred within the time span of 30 years.9 Clearly, past history shows that the assumption of constant immigration rates is not a good one to make. The laws affecting these immigration rates are outlined in Reference 10.
Abortion is an issue not directly incorporated in any of the assumptions involved in curves C-F and X. How much of an effect is the abortion ruling recently made by the Supreme Court? According to the New York Times Index," legal abortions are estimated to be about 900,000 in 1974. It is estimated that 1/3 of these would not have been made if the Supreme Court ruling had been unfavorable toward abortions. This suggests, therefore, that there were 300,000 less people in the U.S. in 1974 as the result of this Supreme Court ruling. Since this reduction is close to the immigration rate (about 400,000/year), it would seem that abortion ought to be considered by the demographers. Furthermore, abortions are on the increase at a rate of more than 25%/year since 1972.11 An extrapolation shows an abortion rate of 100 million/year by 1996, a figure no more ridiculous than some of the current world population extrapolation figures,12 in the author's opinion.
The demographers themselves are at variance with one another. Estimates of the increase in the U.S. population by the year 2000 range from 20 million to 100 million, or a variation of a factor of 5, depending on the demographer.13 If in a situation in which the data are well known, demographers vary in their predictions of U.S. population growth by a factor of 5, over a 30 year period, what about their predictions of world population growth, where the data are not well known?
One should be very cautious about advocating control of world population. One cannot adequately control what one does not understand. The solution to starvation, ecology and energy may lie elsewhere.
The author gratefully acknowledges discussion and comments
from Dr.'s Nicholas Barker, James Hurley, and John Muller, all
of whom are professors at Covenant College.
1Associated Press article, Chattanooga News Free Press, Sept. 19,1971.
2 Penthouse Magazine, Isaac Asimov, "The End," Vol. 2 No. 5, Jan. 1971, 26-28.
3Expanding Population in a Shrinking World, Marston Bates, P. 16f - cited in The Myth of Over Population by R.J. Rushdoony, Craig Press, 1969, p. 41.
4 China: Population in the People's Republic, Population Reference Bureau Bulletin Vol. 27 No. 6, Dec. 197 1, p. 9 & 10.
5The Future Population of the United States,
Population
Reference Bureau Bulletin Vol. 27 No. 1, Feb. 1971, p. 15.
61974 Statistical Abstracts of the U.S., p. 6.
7The Future Population of the United States, op. cit., p. 13.
8Ibid., p. 22.
91974 Statistical Abstracts, op. cit., p. 97.
101974 Statistical Abstracts, op. cit., p. 95.
11The New York Times Index, Feb. 1-15,1975, ABORTION.
12Op. cit., Penthouse Magazine, Vol. 2 No. 5, where Asimov
asserts that "at current rates of increase," the total mass of human
population will equal the mass of the earth by 3530 A.D., and the
mass of the universe by 6826 A.D.!
141t should be noted that a very recent revision has been made in the curves used by demographers for the U.S.A. population. Specifically, in an Oct. 1975 issue of Projections of the Population of the U.S., p. 25, No. 607, all of the lettered curves A-F & X, have been replaced with curves labeled 1, 11, 111 & II-x, with changed demographic assumption, (i.e. lowered birth rates, etc.). Needless to say, most of these most recent curves fit the July 1, 1975 data quite well!
Editor's Note:
In connection with Dr. Keister's assessment of
the U.S. population growth problem, it is interesting to take note
of a 1960 prediction for world population set forth by von
Foerster, Mora and Amiot: 1
N = 1.79 x 10¹¹/(2026.87 -
t)0.99
where N is the world population and t is time measured in years. A.D. Serrin 2 points out that this expression fits world population figures very well from 1750 to 1960. In 1975 the above equation predicted a world population N - 3.65 billion persons, whereas the best estimate for world population as of that date is 3.97 billion persons. The equation predicts a world population of 5 billion persons in 1990, and of course a rather catastrophic occurrence late in the year 2026!
Such concerns as war and peace, environmental pollution, discrimination, and so on, are far from unimportant. They are indeed criticical, . . . But these matters are nonetheless footnotes on the main text, namely, that God has spoken and that what God says is what bears determinatively an all existence and life. The unmistakable priority of Gods people, the church in the world, is to proclaim Gods revealed Word. Divorced from this calling, the church and Christians are undurable and unendurable phenomena. By stifling divine revelation, they are, in fact, an affront to God. Devoid of motivation for implementing Christ's cause, they become both delinquents and delinquent in neighbor and world relations.
God, Revelation and Authority, Vol. Il God Who Speaks and Shows, Word Books, Waco, Texas (1976), P. 22.
Leading, multimillion dollar corporation in the service industry located in a western suburb of Chicago has excellent growth opportunity for a Technical Manager to direct activities of such corporate functions as product and process development, applied research, quality control of chemical manufacturing and technical services.
This rapidly growoing company is involved in all areas of business including manufactur~g~Zsearch and development, franchising and international operations. Kno e of government and industry regulations is desired.
Our Corporation strives to attain four objectives: 1) To honor God in all we do; 2) To help people develop; 3) To pursue excellence; 4) To grow profitably.
if you have a solid technical background (preferably with an advanced degree in a chemical field), a proven record as manager of technical personnel and resources, and a desire far a challenging, demanding and rewarding career opportunity, send a detailed resume "th salary history in confidence to:
