
I Introduction
The purpose of this paper is to describe techniques for modeling or simulating the behavior of complex social processes which have been made possible by rapid developments in computer technology. Uses of this simulation method will be discussed which indicate the role that simulation plays in the larger process of system cybernation or control and the use of simulation as a means of developing and testing scientific
*Thomas J. Manetsch was with the Department of Engineering, University of California, Los Angeles and is currently in the College of Engineering, Michigan State University, East Lansing. Paper presented at the 20th annual convention of the American Scientific Affiliation at The King's College, Briarcliff Manor, New York, August, 1965.
The latter portion of the paper describes in some detail an idealized simulation model of the process whereby attitudes are propagated within a population of human beings.
The model is an example of what is termed the macrodynamic type of simulation and includes a basic causal mechanism characteristic of a class of attitude
propagation processes. Tests of the simulation model are described which explore the implications of the model and serve to illustrate the application of such a model.
In this section the capabilities and limitations of the simulation approach will be discussed along with attributes which characterize four general types of system simulations. A brief description of significant work done to date in the simulation of social processes will illustrate the current status of the field.
A. Simulation DefinedThe historical development (5, 6, 7, 8, 13) indicates that simulation is usually part of the larger process of system control or-cybernation (3,14).1
This attribute of simulation has significant implications for the social sciences and will be discussed in some detail. On the other hand there are some limitations of the simulation methodology which often have to do with determining when a simulation "acts like" the real system. These also will be discussed in what follows.
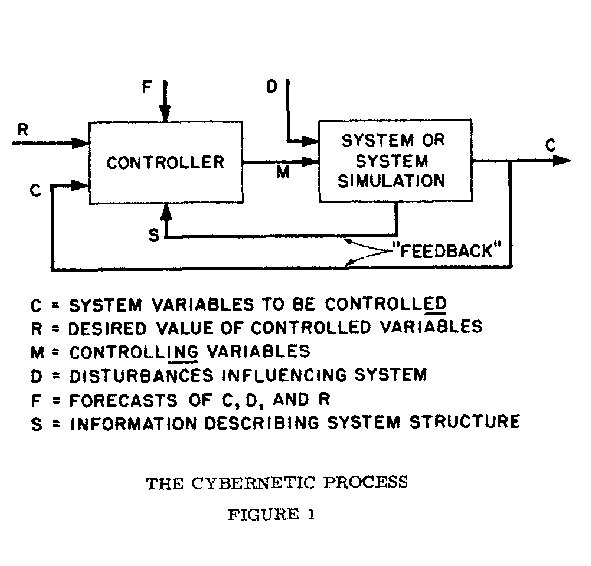
B. The Potential of the Simulation Method The most significant potential of the simulation method would appear to lie in the important role that a system simulation can play in the control or cybernation2 of that system. The relationship of system simulation to the larger process of cybemation is illustrated by Figure (1). The figure depicts an arbitrary system which is being controlled by a "controller". This system has a set of controlled variables, designated "C" in the figure, which are to be adjusted so that they are approximately equal to a corresponding set of desired values "R". The behavior of the system as measured by the values attained by the variables "C" is determined by the "input" variables to the system, "M" and "D'. These are independent or exogenous variables which are not dependent upon the system under control. "M" represents the set of controlling variables-those variables which can be specified in order to achieve changes in the controlled variables "C". On the other hand "D" represents a set of exogenous disturbances (in most cases random) which cannot be used as controlling variables but rather make control of the variables "C" more difficult.The "controller" in figure is shown receiving information about "C"-the current state of affairs, "R"- desired state of affairs, and two other sets of information "F" and "S". "S" represents information concerning the structure of the system under control and the relationships that exist between the controlling variables "M" (causes) and the controlled variables "C" (effects). "F" represents any forecast information which may be available about the future values of C, R, S, and D.
On the basis of these definitions the operation of a general cybernetic process will be described. Simply stated the "controller" receives "feedback" information concerning the actual state of affairs "C" which it compares with the desired state of affairs "R". On the basis of system information (S) and forecast information (F) it generates a set of control signals (M) which will cause C to more closely approach R. Reflection will indicate that this basic control process is common to many areas of human experience social as well as physical.
Before proceeding to discuss the role that system simulation can play in this cybernetic process a specific example of this process will be given which will serve to ellucidate the above discussion while providing a basis for discussing the need for a system simulation. Consider the system under control to be a human being and the automobile he is driving. In this case the variables to be controlled, "C", include the speed of the car, its lateral position on the highway and its position relative to other cars. The variables "R" in this case are the desired speed and position as determined by the driver. Disturbances "D" might include bumps in the road, actions of other drivers and other external factors which impair controllability. Forecast information "F" includes knowledge concerning curves ahead, cars ahead and their speed etc. System information "S" is embodied in the "feel" that the driver has acquired about the characteristics of the car through experience-sensitivity to changes in throttle and steering wheel position, roadability etc- On the basis of all this information, the controller, the drivers brain, generates a set of control signals which through muscular motion adjust the throttle, brake and steering wheel positions (the controlling variables "M") such that the actual position and speed of the car are acceptably close to the desired values.
In the example cited the information "S" concerning the characteristics of an automobile is indispensable to the satisfactory control of the system. A driver must learn to drive (or learn to control) by experimenting with an automobile and learning its characteristics. In many complex social systems human beings find themselves in an analogous control situation but with an important restriction. They are usually not able to experiment adequately with the system in order to acquire the information necessary for satisfactory control ie, due to the risks involved it is not usually practical for economists to "experiment" extensively with the national economy. Social scientists have, by-and-large, had to content themselves with the experiments and data that circumstances provide them.
At this point the impact of system simulation upon system cybernation becomes quite clear. Suppose that in place of the "system" in Figure (1) a system stimulation is inserted which "acts like" the real system. Numerous and varied experiments can be carried out using this simulation by simply making changes in a computer program. On the basis of these experiments and the resulting system information, S, a set of refined control signals "M" is derived which can be applied to achieve improved control of the real system. At the present time the "controllee' function in most complex systems is performed by human beings but many prophets (3) foresee the day when highly sophisticated computers will prove superior to human beings in this function and ultimately replace them. (If this is a frightening thought perhaps comfort can be taken in the fact that man would still be responsible for establisbing goals "R" and would hopefully provide constraints on the means used to achieve goals.)
A second potential of the simulation method will be briefly mentioned here. Simulation, as an extension of mathematical modeling techniques, is a means of testing scientific theories and can play a significant role in the development of theories. The simulation, a theory about the real world, can be quickly exercised under various conditions to determine the consequences that logically follow by deduction. It can therefore be determined whether or not a given theory satisfies certain necessary conditions for validity. The simulation, then, serves as a means of testing a theory. Should the theory prove inadequate as initially conceived, the simulation can be used as a part of the creative process whereby the theory is refined. Information "fed back" to the investigator concerning the deficiencies of the theory (simulation) can lead to changes in the structure of the theory which cause it to better represent the real world-that is make it a better theory. This iterative procedure whereby tests of a simulation lead, through human intelligence, to successive theory improvements can be viewed as a special case of the cybernetic process of Figure (1).3
C. Classes of SimulationsFor purposes of discussion here it will be useful to define four broad classes of simulations. These classes arise from consideration of how simulations are constructed and what they are designed to do. A simulation may be designed to simulate the interactions of basic system units or the interactions of aggregates of basic system units. In the former case the simulation will be termed "microscopic" and in the latter case ,'macroscopic". Thus a sociological simulation may be designed to simulate either the behavior of individual people or the behavior of groups of people. The microscopic approach to simulation has the advantage that it Is probably more realistic than the macroscopic approach but it may prove to be prohibitively complex in certain cases. Due to its relative simplicity, the macroscopic approach appears to be preferable where the error introduced by aggregation is not intolerable. Some significant work relating to aggregation and the conditions under which aggregation may logically proceed is due to Ando, Fisher and Simon (2).
A second basic distinction which proves to be useful arises from consideration of what a simulation model is designed to do. A simulation may be designed to predict the state of the real system variables at one single point in time under a fixed set of exogenous conditions or it can be used to predict the time path of the real system variables given the time path of exogenous conditions. In the former case the simulation is said to be "static" and in the latter case "dynamic". Cohen (4) refers to static simulations as being "computer models" and dynamic simulations as "process" models. Examples of static and dynamic simulations taken from the literature will be cited below.
Before examining the current status of social simulation as reflected by the literature, terminology will be introduced which aids in classifying simulations on the basis of the attributes described above. The options microscopic-macroscopic and static-dynamic, give rise to four basic types of simulation models which will be referred to as:
microdynamic macrostatic
The possibility of constructing hybrid models incorporating two or more of these basic types also exists but will not be discussed further here.
D. Current Developments in Social SimulationIn light of burgeoning developments in this -field an attempt will be made to briefly summarize what appear to be two of the more important sociological applications of simulation to date. It will not be possible to discuss important economic applications (4, 5, 6, 7, 81 9) here.
Perhaps the
most advanced social simulations to date are those of Pool, and Abelson (13) and
Abelson and Bernstein (1). The former study simulates certain aspects of the
1960 U.S. presidential election and is an example of what has been referred to
above as a macrostatic simulation model. The model is macro because it considers
the U.S. voting population to be aggregated into 480 voter types which are
handled by the computer instead of individual voters.4 These voter
types are defined on the basis of party preference, geographical location, race,
religion, economic status, sex and upon whether the voter resides in an urban or
rural area. The
data for the simulation came from approximately 100,000 public opinion
interviews over the period 1952-1958. This data reflected opinions on 52
political issues and also indicated the number of each voter type residing in
each state. Applying what socioogists term "cross-pressure theory",
the simulation This model operated on this data to predict election if different
issues were stressed during the campaign. This
model is an example of what has been defined as "static" because it
predicts voter attitude at some single point in time rather than tracing out the
path of voter attitude over time. The authors report a high correlation (.82)
between a simulation model stressing the religious (Catholic president) issue
and actual election results and claim on the basis of empirical evidence that it
is reasonable to assume that the religious issue was, in fact, stressed during
the campaign.
The second simulation study mentioned above, that of Abelson and Bernstein (1),
is an example of a micro-dynamic simulation model. The study concerns itself
with the time path of the attitudes of 500 individuals during a 12 week local
referendum campaign in which the issue is whether or not the community should
adopt water fluoridation. In addition to the demographic data used by the Pool
and Abelson model, the following data was also available for each of the 500
individuals represented in the simulation: frequency of exposure to several news
channels; attitudes toward well known persons and institutions in the community;
knowledge and acceptance of standard assertions pro or con on the issue;
interest in the issue; intitial position on the issue;
voting history in local elections; predisposing experiences and attitudes toward
the campaign arguments; frequency of conversation about local politics and the
demographic characteristics of conversation partners. With the above data it was
possible to consider both the effects of mass media and personal influence upon
attitude change. Each simulated week of the campaign each of the 500 individuals
in the computer population is probablistically exposed to assertions on the
issue as presented by local communication sources and then each engages in
conversations in which partners present their own assertions. By applying in
excess of 40 basic propositions concerning human behavior the computer
generates, for each individual of the 500, the time path of attitudes toward the
assertions, interest in the issue, and finally attitude toward the issue itself.
The paper describes initial tests of the simulation using data obtained from a
simplified "mock" referendum. No attempt was made to achieve a precise
representation of an actual sample-"since data penetrating to the level of
detail needed for the computer model do not yet exist."
E.
Limitations of The Simulation Method
Perhaps the most obvious limitation of simulation lies in that a simulation is
always an approximation of
reality. The sheer complexity of any system, social or physical, forces the
introduction of simplifying assumptions into the simulation. These
simplifications are necessary because of constraints imposed by existing
theory, computer technology, time and money. The field of social
simulation is too young to adequately assess the long run impact of these
constraints.
A second limitation of the simulation method relates to difficulties involved in validating a simulation model problem is particularly acute in the case of what has been defined as vast amounts of data. It is often difficult to acquire the corresponding real world data for purposes of validation. This problem was encountered by Abelson and Bernstein (1) as indicated by the last sentence of (D) above. A second problem associated with validation of social simulations arises because of the stochastic nature of these systems. Due to the chance or random factors which influence the behavior of such systems, ("D" in Figure 1) even an ideal simulation can not be expected to behave exactly like the real world system. For this reason statistical tests of validity must be employed. In the case of complex dynamic simulations appropriate statistical tests have not as yet been determined.
Due to
these difficulties presently associated with formal validation procedures it is
not uncommon to
trating to the level of detail needed for the computer apply a pragmatic
approach to the problem. The results
of simulation runs can be evaluated by unbiased persons who are well acquainted
with the situation being modeled. in the case of business firm simulations,
management personnel are in an excellent position to perform such an evaluation.
A model which passes this first credibility test is then used with guarded
caution as an instrument of policy making to further test its usefulness.
III
A Macro-dynamic Simulation Model of the Attitude Propagation Process
This section describes in some detail a third basic type of simulation model of the four defined. The model represents in macrodynamic terms certain aspects of the process whereby attitudes are propagated within a population of human beings. It was initially motivated by an interest in the application of simulation methods to the propagation of the Christian faith. The model does not represent a particular real world situation and at a number of points omits factors which may be relevant to particular situations of practical interest. This was done to focus attention on a particular causal or "feedback" (14) mechanism which appears to be a common denominator in processes of this nature and to provide a relatively simple framework within which the methodology employed could be studied.
In what follows, the methodology of the study will be described followed by a non-mathematical description of the model.5 Tests of the model will be described which will illustrate the characteristics of the model and applications of the simulation method.
A. The Macrodynamic ApproachAs discussed, a macroscopic model, instead of simulating each microscopic unit in a system, considers the system to be composed of aggregates of microscopic units. A macrodynamic model then approximately represents, by the interactions of groups or aggregations, the time path of real system variables. Formally stated the macrodynamic approach to simulation proceeds as follows:
2) Simulation of the aggregate (sector) behavior of microunits.
3) Simulation of the interactions among sectors as approximating the interactions among microunits.An example will serve to clarify the method. In a recent economic study of the U.S. Plywood industry (10) it was learned that certain firms of the industry (the 1. microunits") were subject to the same "external influences", market forces and national construction activity in this case, and due to similar organizational structure and technology "exerted similar influences upon their environment" in terms of sales policies, ordering policies, price policies, etc. Such firms which formed more or less homogeneous groups were aggregated into sectors. The entire industry of more than a thousand firms was approximately represented by seven sectors which were simulated along with the interactions that take place among sectors. As a dynamic simulation the model generated time paths of industry variables such as price, aggregate production, orders and inventory levels.
This macrodynamic approach to the study of large scale economic systems is quite common (4, 6, 7, 8, 10) and shows considerable promise in that field. The usefulness of this method when applied to sociological processes has not been thoroughly researched but appears to be worthy of further study.
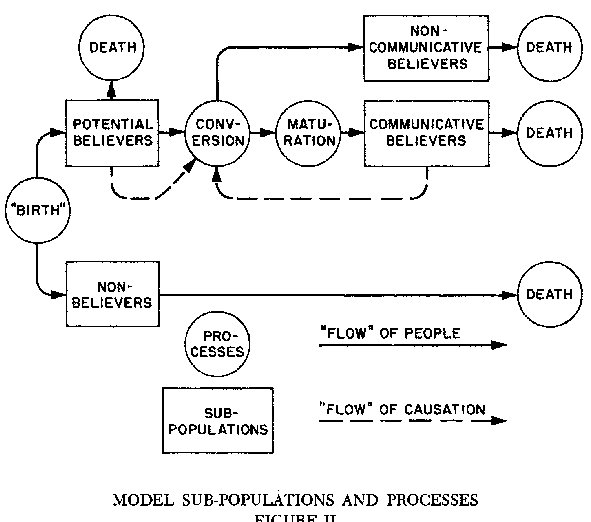
B. Model DescriptionThe attitude propagation model, as a macroscopic model, assumes that the population under consideration can be divided into the four sub-populations or sectors of Figure 2. The attitude propagation process is then simulated by simulating the four sub-populations and the interactions that occur among them. The simulation model assumes a general population of mature individuals capable of adopting or rejecting the attitude in question (call this attitude "A"). This population is actually the sum of the four sub-populations shown in Figure 2. As is approximately the case in contemporary society, the general population grows exponentially with time in the model.
The four sub-populations in Figure 2 will now be described. As a result of a "birth" process people enter one of the two sub-populations labeled "Potential Believers" or "Non-Believers" in the figure. This "birth" process should be thought of as the process whereby individuals reach a level of maturity necessary to rationally adopt or reject "A". The "Potential Believer" sub-population is an aggregation of all persons who, for cultural and other reasons, are prone to adopt attitude "A" and will adopt it given sufficient exposure. The "Non-Believer" sub-population is conversely an aggregation of individuals who won't adopt "A" under any circumstances. As shown in the figure the only means of exit from the latter named sub-population is death; however, exit from the Potential Believer subpopulation may take place by either death or a conversion process which will be discussed later. Converts may go in either of two directions. They may enter a sub-population designated "Non-communicative Believers" or they may enter a maturation process which also will be discussed later. Persons who become "Non-communicative Believers" have adopted "A" but play no part in the process of communicating "A" to the general population. On the other hand, individuals who emerge from the maturation process become part of the "Communicative Believer" sub-population shown in the figure. "Communicative Believers" are active in communicating "A" to the general population and play a role in the conversion process as indicated by the flow of causation in Figure 2. As shown in the figure, death is assumed to be the only means of exit from the latter two sub-populations.
For each sub-population the simulation keeps track of persons entering and leaving and continuously computes the number in each sub-population. This information is used to compute the birth rate, death rate and conversion rate.
The simulation assumes that conversions take place as a result of "proclamations" of "A" by the Communicative Believer sub-population. The proclamation rate is taken as equal to the number of Communicative Believers times a parameter K8 which determines the average number of proclamations made per unit time by Communicative Believers. (This parameter can be changed from one simulation run to the next and will be seen to have a strong influence upon the behavior
of the model). The model assumes that these proclamations are made to the general population at random and hence only a fraction reach Potential Believers. This fraction is seen to be the ratio of the number of potential believers to the number in the total population. The simulation further assumes that only a fraction of Potential Believers receiving proclamations are converted on a given exposure to "A". The above discussion relating to the determination of conversion rate is summarized by the following equation from the computer program for the simulation:
RCON (t) = (K8) (NPRC (t) ) (NRES (t) / NPOP (t) ) (PERC (t) )where:
RCON (t) =Conversion Rate-persons/ week
K8 = Number of proclamations per communicative believer per week
NPRC (t)
=Number of Communicative Believers
NRES (t) = Number of Potential Believers
NPOP (t) =Number in General Population (all sub-populations
combined)
PERC (t)
= Probability that a Potential Believer is converted on a given exposure to
"A"
t = time
Since "negative" proclamations are not allowed in the model, RCON (t) is always positive and the conversion process is irreversible in simulation runs.'The conversion process also includes a time delay which makes it possible to introduce into the simulation any lag that may exist between exposure to "A" and conversion. The simulation accounts for the fact that this delay varies from person to person (12).
As included in the simulation, the maturation process is a time lag similar to the conversion lag above. This lag simulates any time delay that may exist between the time of conversion and time the convert becomes active in communicating "A" to the general population. As will be seen from tests of the simulation model, changes in this lag have significant influences upon the behavior of the model variables.
Before describing tests of the simulation model, the basic causal mechanism of the model will be elaborated. As seen from the above discussion a change in the number of Communicative Believers results in a change in the proclamation rate which in turn affects the conversion rate and by means of the maturation process the number of Communicative Believers is reaffected. This is an example of a causal or "feedback" loop. Systems with such loops embedded have rather unique properties and have been studied by many investigators including Truxal (14). This particular causal or feedback loop is readily seen to be explosive ("regenerative" or "positive" in engineering parlance). That is, once started in a particular direction the sys-

proclamation rate
(K8) and maturation delay (DELM). The results of a number of computer runs
incorporating such changes are given in Table Il along with those of standard
run LLIL Tbe nomenclature of the table is as follows:
C. Model Tests
Tests of the simulation model will be described which illustrate the influences
of changes in the proclamation frequency of Communicative Believers, as
determined by the parameter K8 described above, and maturation delay, referred
to as DELM in what follows. Before describing the results of particular
simulation runs general features of the tests will be briefly discussed.
In all tests, the parameters determining birth rates and death rates are
assigned values which result in a
general or total population which increases with time as is the case in society
today. The initial numbers of
persons in each of the sub-populations of Figure (2) at the start of simulation
runs were chosen to specify
an initial state of model dis-equilibrium. Computer runs, then, specify the time
path of model variables as they move toward equilibrium. Specifically initial
values were assigned as indicated by Table 1:

The results of a typical simulation run are shown in Figure 3. The scale along
the bottom of the graph represents time in weeks with 2880 weeks or
approximately 60 years of system behavior represented. The curves represent the
time paths of the model variables indicated at the left of the figure along with
the vertical scales applicable. For example the graph labeled "Y',
referring to the total population NPOP, has its initial value of one at time
equal to zero weeks and grows to a value of 10 after 2880 weeks have elapsed.
The graph labeled "5" refers to the ratio of the number of
communicative believers to the number in the total population, NPOP. This
variable starts from its initial value of .05 and as the attitude propagation
process proceeds reaches a maximum of about .25 at time equal to 550 weeks and
gradually settles to an equilibrium value of .2. The graph labeled "6"
represents the ratio of the number of all believers (communicative and
non-communicative) to the number in the total population, NPOP.
Computer run 1. IA of Figure (3) was used as a standard run" for assessing the impact of changes in proclamation rate (K8) and maturation delay (Delm). The results of a number of computer runs incorporating such changes are given in Table II along with those of standard run 1.1A. The nomenclature of the table is as follows:
K8 = Parameter which determines the average number of proclamations per communicative believerMAX 6 ~ Maximum value attained by the ratio of the number of all believers to the number in the total population (NMBR/ NPOP)
EQ 5 = Equilibrium value
attained by the ratio NPRC/NPOP
EQ 6 = Equilibrium value attained by the ratio NMBR/NPOP
Run 1.IE in
Table II indicates the influence upon the model of a decrease by a factor of two
in proclamation frequency as determined by K8. This change results in a marked
reduction in the number of believers after the process has reached equilibrium
(EQ5 and EQ6) and a significant increase in the time required for the process to
reach equilibrium (TMAX 5, TMAX 6). Run 1.1F indicates that the converse is true
when K8 is increased by a factor of two. Runs 1.1 G and H illustrate
respectively the influence of increasing and decreasing the maturation lag by a
factor of two. While not as significant as changes in proclamation rate, changes
in maturation lag do have a noticeable effect upon the behavior of the model.
The main conclusion to be drawn from these tests is that, under the assumptions of the model; the proclamation rate of Communicative Believers and to a lesser extent the maturation delay are significant in determining the effectiveness of the attitude propagation process described. These results should not be applied to a particular real world situation without carefully examining the special conditions which actually prevail. Many additional factors such as those included in the models of Pool and Abelson (13) and Abelson and Bernstein (1) should also be considered in any attempts to model a real world situation.
IV Concluding RemarksOn the basis of the foregoing, some opinions will be hazarded with respect to the social impact of the techniques described. Firstly, it seems clear that automated cybernation of complex social processes would be, from a technological standpoint, a long time in coming. In the realm of control of complex physical and chemical processes, automated control has proved to be a formidable undertaking and progress has been slower than originally anticipated. There is the possibility however that developments in the physical realm will speed social applications.
Of more immediate interest, it appears that simulation, by providing the social scientist with a laboratory for controlled experiments, is truly a breakthrough for the social sciences from which greater understanding of social phenomena will result. It appears that effective research in this new area must be interdisciplinary in nature with social science blended with computer science and systems science in an organized approach to problems. Since individuals who are expert in all these areas are quite rare today, it would appear that in many cases a team approach is necessary for work in this field.
Lastly, it appears that these methods hold promise for increased understanding of the interaction of the Christian faith with the remainder of society and that this possibility should be thoroughly explored by Christian scholars.
2. "Cybernetics" is here taken to mean the general science of control divorced from a particular discipline. Early usage of the word implied interaction of human beings with machines.
3. In this case "It" should be viewed as the actual behavior of the real world and "C" the behavior of the simulation under the same exogenous conditions. The "controller" in Figure (1) is a human being who generates a set of model structure changes "M" such that "C" is acceptably close to "R". While "F" and "D" in Figure (1) do not apply in the case of the theory building process, information "S" concerning model structure is necessary for the investigator to constructively generate structural changes in the theory.
4. This is the "480" of Eugene Burdick's current political novel.6. The center colrum, contains the notation used in the simulation program to designate certain populations. This notation will appear in subsequent discussion of computer runs.
1. Abelson, Robert P. and Alex Begrokim, -A Computer Simulation Model of Community Referendum Controversies," Public Opinion Quarterly, 27 , Sprng 1963,
2. Ando, Albert, Franklin M. Fisher and Fl-b-t A- Simon, Essays on the Structure of Social Seim" Madsla, The M.I.T. Press, Cambridge, 1963.
3. Beer, Stafford, Cybernetics and Management, John Wiley and Sons, New York, 1964.5. Forrester, Jay W., "Industrial Dynamics - A Major Breakthrough for Decision Makers," Harvard Business Review, July-August 1958.
6. Forrester, Jay W., Industrial Dynamics, The M.I.T. Press and John Wiley and Sons, New York, 1961.7. Holland, Edward P., "Simulation of an Economy with Development and Trade Problems," American Economic Review, 52, 408-430, 1962.
8. Holland, E. P. with R. W. Gillespie, Experiments on a Simulated Underdeveloped Economy, The M.I.T. Press, Cambridge, 1963.
9. Klein, Lawrence R. and A. S. Goldberger, An Econometric Model of the U.S., 1929-1952, North-Holland Publishing Co., Amsterdam, 1955.
10. Manetsch, Thomas J., "Simulation and Systems Analysis of the United States Softwood Plywood Industry," Ph.D. Thesis, Oregon State University, Corvallis, 1964.
11. Manetsch, T. J., A Macroscopic Model of the Attitude Propagation Process, UCLA Department of Engineering, February 1965.
12. Manetsch, T. J., Transfer Function Representation of the Aggregate Behavior of a Class of Social Processes, I EEE Transactions on Automatic Control, October 1966.
13. Pool, Ithiel de Sola and Robert P. Abelson, "The Simulmatics Project," Public Opinion Quarterly, 25, Summer 1961.
14. Truxal, John G., Control System Synthesis, McGraw Hill, New York, 1955.